Today I tried Google Spreadsheets. First thing I discovered, there is no charts function! Lots of other online online spreadsheet sites do offer charts, but if for some reason, you have to use Google's service, there is a little work around which offers a very basic and simple solution.
First, this solution wasn't discovered by myself, it's a trick I learned from juiceanalytics.com. It is intended for Excel but also works for Google Spreadsheets.
These in-cell bars are created using the repeat (REPT) function. REPT looks like this:
=REPT("text",number of times)
For example =REPT(X,5) gives you XXXXX. For in cell bars, use the letter I and set the font size to 10 or even smaller. "Number of times" can also be variable, I doesn't need to be a fixed value.
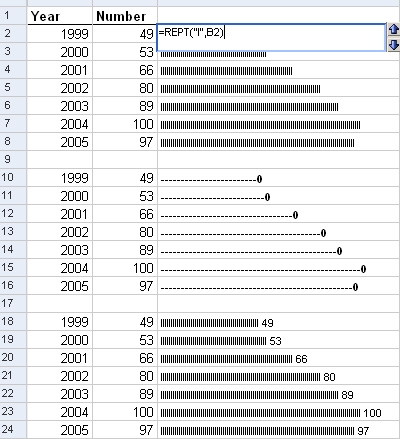
For instance:
=REPT("I",B2) would print the letter according to the value in cell B2.